Adapted from Reproducible Science for Busy Researchers: How to Save Time using Literate Programming, by Andrew P. Lapointe
Artwork by Allison Horst
Please be sure to complete the following before class:
install.packages("ggalt") # extra coordinate systems, geoms, statistical transformations, scales and fonts for 'ggplot2' (includes `geom_lollipop()`)
install.packages("ggExtra") # {ggplot2} extension2222 which can be used to add marginal histograms/boxplots/density plots to ggplot2 scatterplots
install.packages("ggdensity") # {ggplot2} extension providing more interpretable visualizations of density estimates based on highest density regions (HDRs)In lecture 4.1, we’ll be exploring income data from the Bureau of Labor Statistics and the Census Bureau, which has been moderately pre-processed by TidyTuesday organizers for the March 5, 2021 data set.
Please review the necessary background information (see slide 4) and walk through the data wrangling code on slide 5 ahead of class. Come prepared with any questions you may have about the code – we’ll set aside ~10 minutes to discuss before jumping into building our data visualizations.
Week 4 instruction is broken down into two lessons:
Visualizing rankings
Visualizing relationships
Last week’s discussion focused on recreating the data layers of the U.S. Drought Monitor’s visualization of CA drought conditions through time. This week, you’ll focus on refining the theme (non-data plot elements) to match the original visualization as closely as possible.
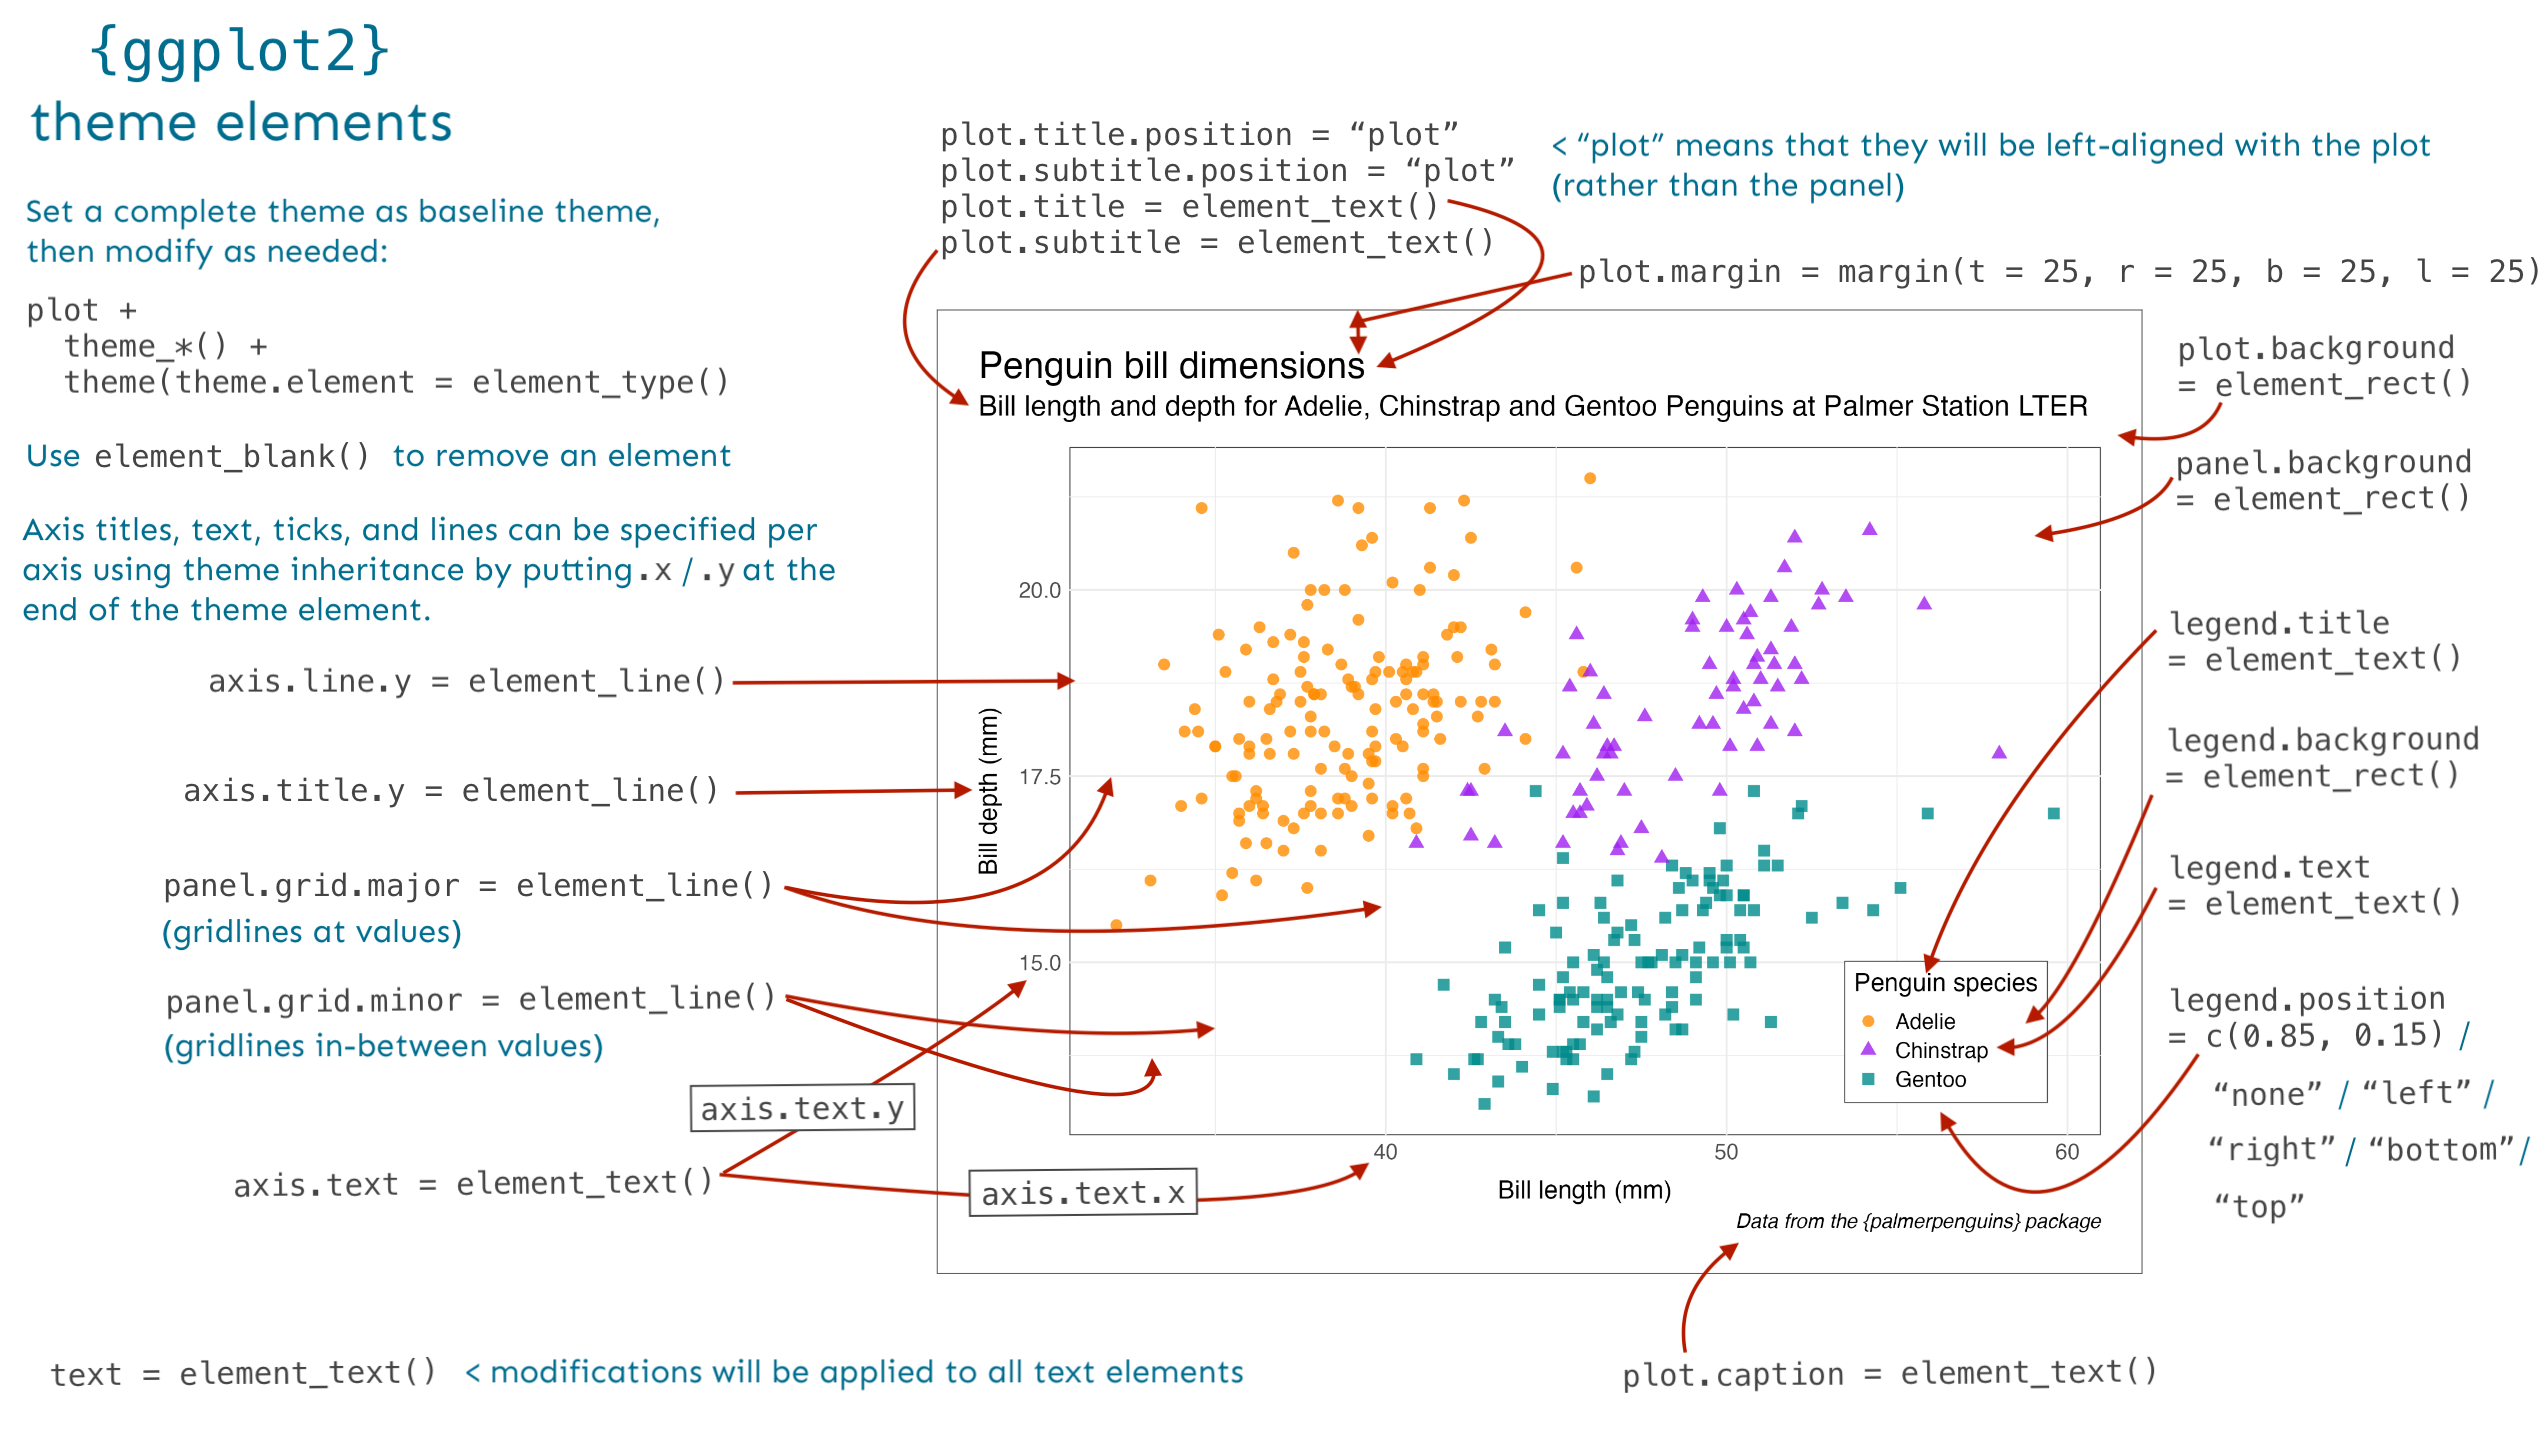
Themes are used to modify the non-data components of plots (e.g. titles, labels, fonts, background, gridlines, legend). In addition to using pre-built themes (available via the {ggplot2} package and also from extension packages), you can fine-tune the appearance of your plots theme by making adjustments using the theme() function.
{ggplot2} comes with eight complete themes, which can be applied as-is, or further modified using theme() (see next section, below). There are also many additional themes which can be applied via ggplot extension packages. A small handful of packages are listed in the expandable note, below:
ggplot2::theme() to control plot elements:Use this (non-exhaustive) list to start tweaking elements of your plot’s appearance. It’s most common to start with a pre-built theme (see above) and modify from there. For a complete list of elements, explore the documentation for ggplot::theme().
Adapted from Reproducible Science for Busy Researchers: How to Save Time using Literate Programming, by Andrew P. Lapointe
You’ll get the most out of discussion section if you physically type out the code yourself (rather than copying / pasting)!
Note: Much of the following code (data wrangling and ggplot code) was copied over from last week’s discussion materials. Newly added theme code begins below the comment, NEWLY ADDED THEME CODE!.
| Assignment Type | Assignment Title | Date Assigned | Date Due |
|---|---|---|---|
| EOC | EOC (week 4) | Mon 01/29/2024 | Mon 01/29/2024, 11:55pm PT |
| HW | Homework Assignment #2 | Mon 01/22/2024 | Sat 02/03/2024, 11:59pm PT |