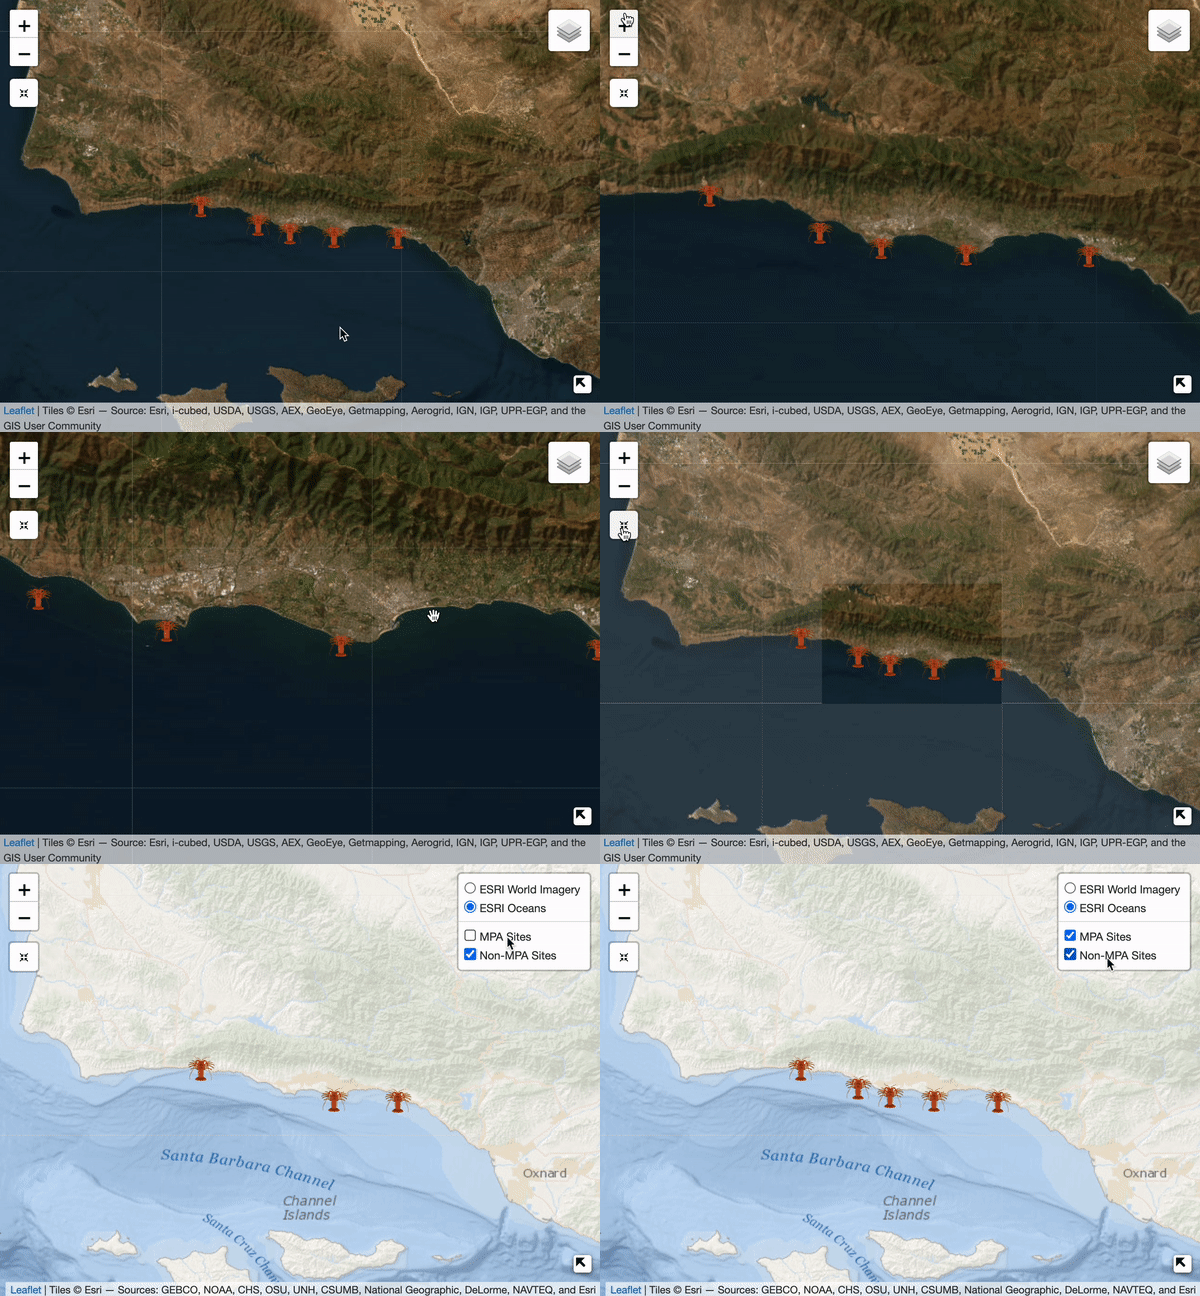
An interactive map made with the {leaflet} R package.
Abstract
JavaScript, a programming language used to create dynamic web page content, is becoming an increasingly popular data science tool for building interactive data visualizations. However, learning an entirely new programming language can be time prohibitive and unrealistic for many researchers. Lucky for R users, there’s an app (well, R packages) for that!
In this hands-on live-coding workshop, we’ll explore the {DT}, {plotly}, and {leaflet} packages, which make JavaScript libraries more accessible for R-users looking to infuse their static visualizations with interactivity. Together, we’ll build an interactive table, plot, and map, and demonstrate how these outputs can be shared using open data science communication tools, like RMarkdown and Quarto.
Audience
This workshop was developed for and taught during the SORTEE Workshops and Webinar series.