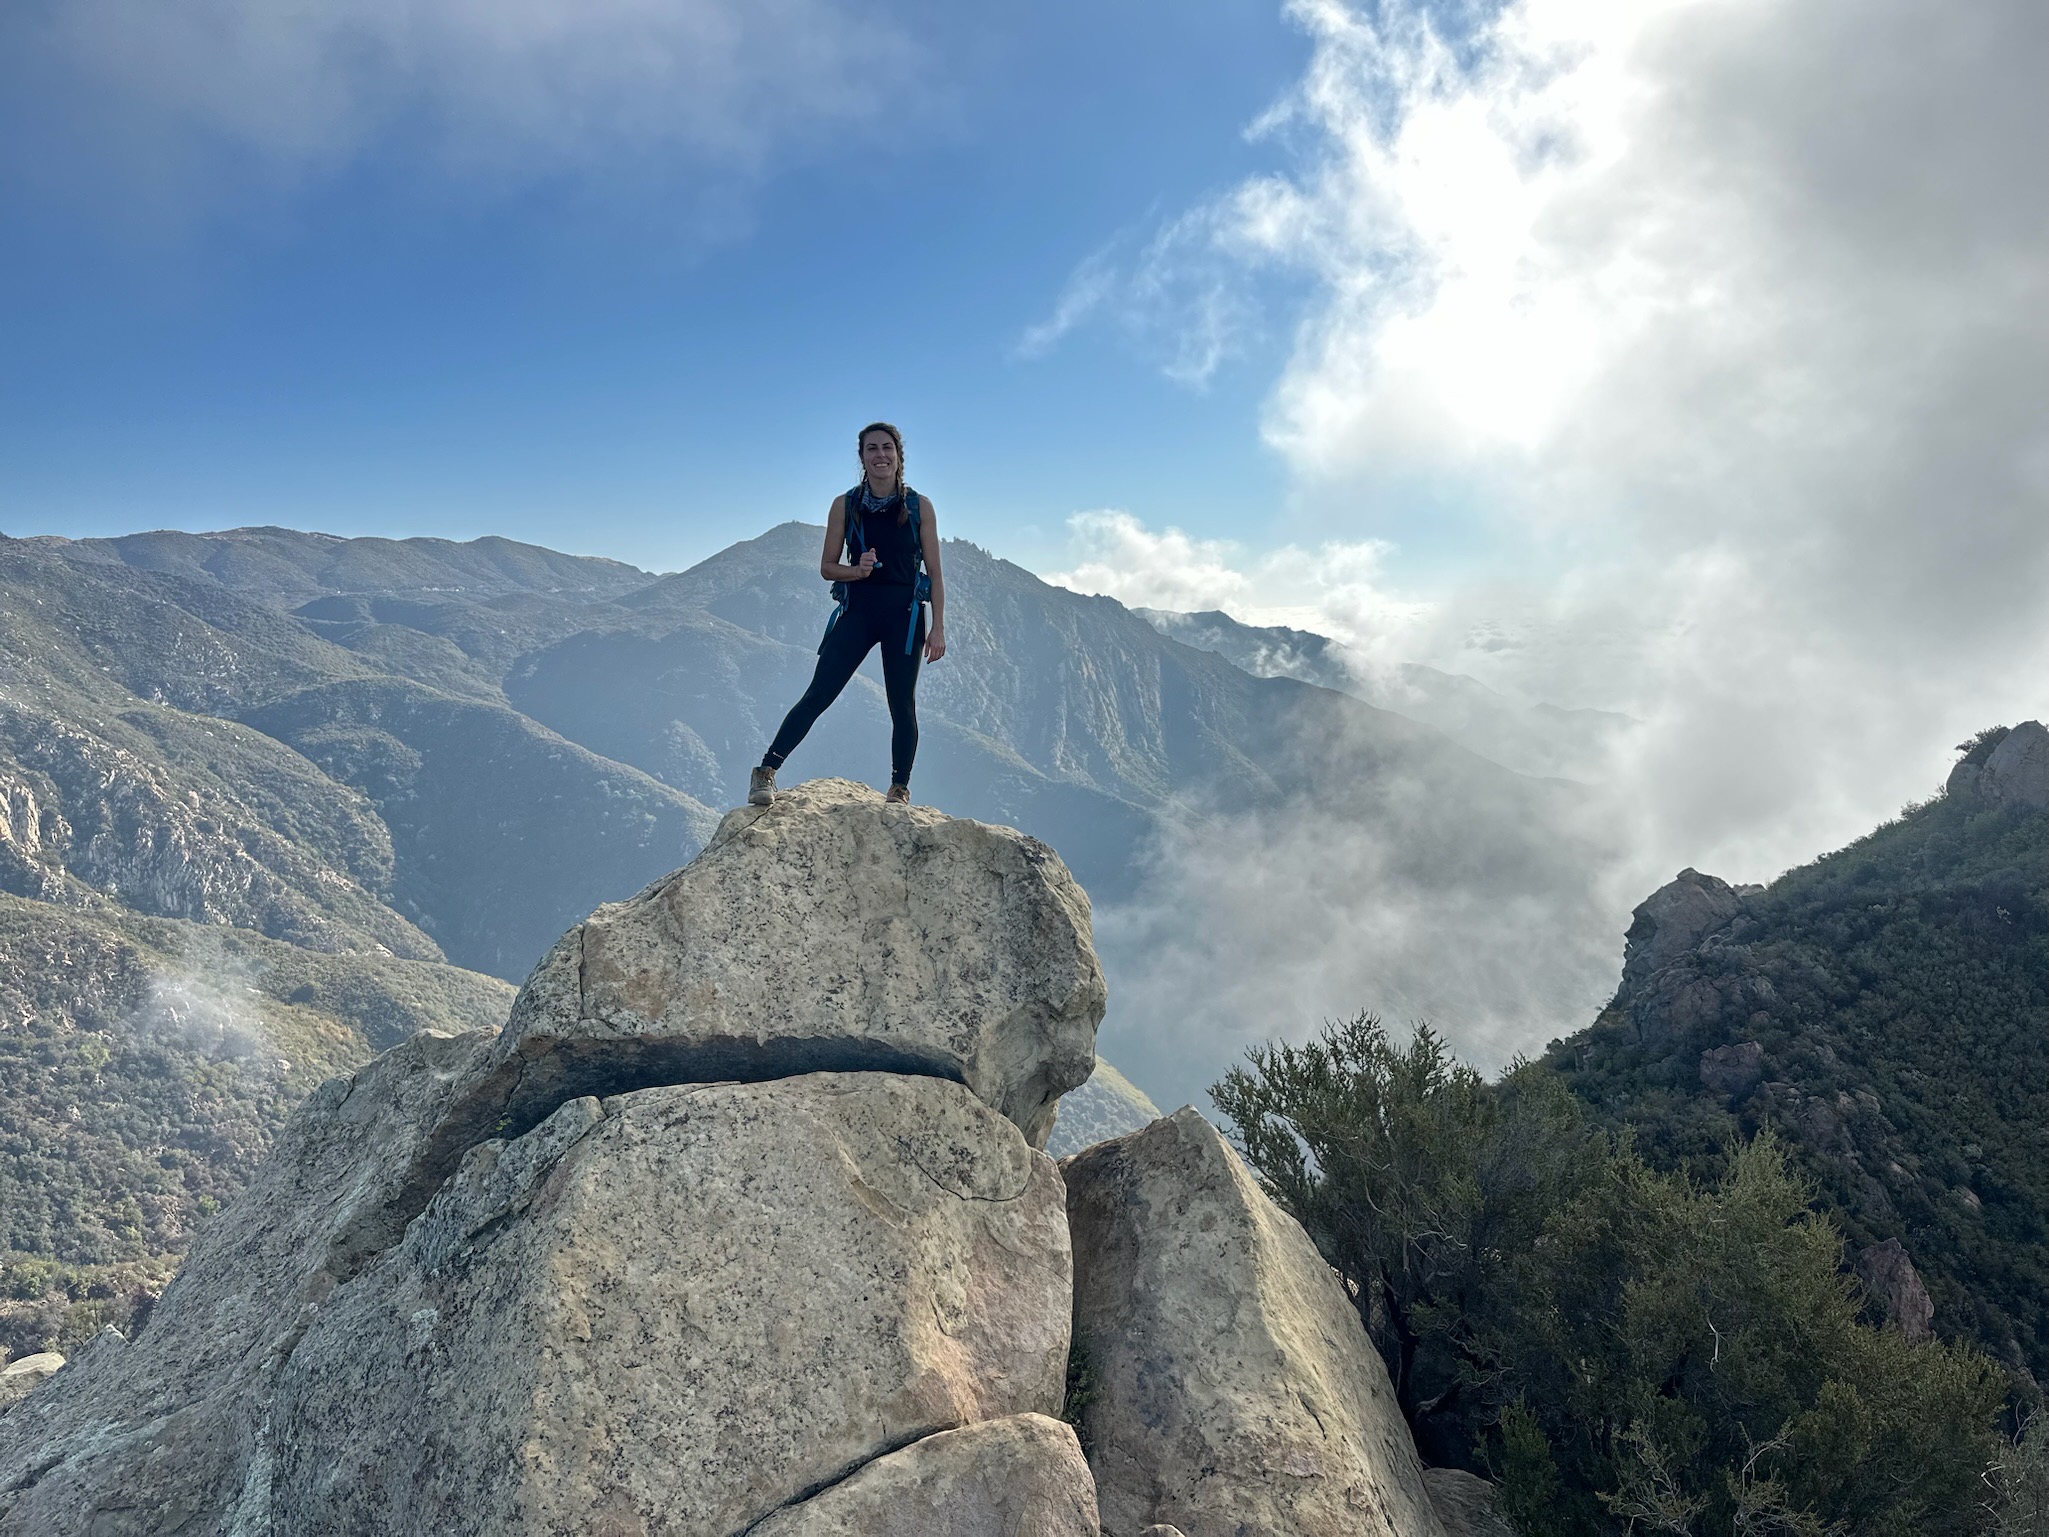
It doesn’t get much better than playing around with data that mean a lot to you. For me, that’s my Strava data (yes, I do recognize that that might sound a bit silly) – I’m fortunate enough to have near-immediate access to some of the greatest hiking trails around (yes, I also recognize that I’m totally biased), and spending my free time romping around our local mountains has been so important for my mental health. So, when I was ready to do my first real deep-dive into learning how to build Shiny apps and dashboards, I knew these were the data I needed to use.
This is very much an ongoing work in-progress, but the first version included a “Gear Garage” for tracking mileage on my hiking boots and bike, an activity heat map of all recorded hikes, bike rides, and walks, visualizations for exploring activity distance and elevation gain, and an interactive table of the raw data.
There are many more visualizations and features I’d love to add (but have been severely lacking the time to do so). I also still manually retrieve new activities using the Strava API via the {rStrava} package, but I hope to automate this in the next version. Stay tuned!

Cathedral Peak, Santa Barbara, CA